Digital Transformation for a Healthy Future, MeditriX
Mind Chair

MindchairMind Chair
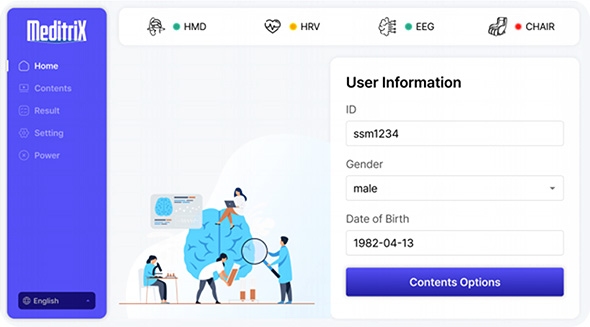
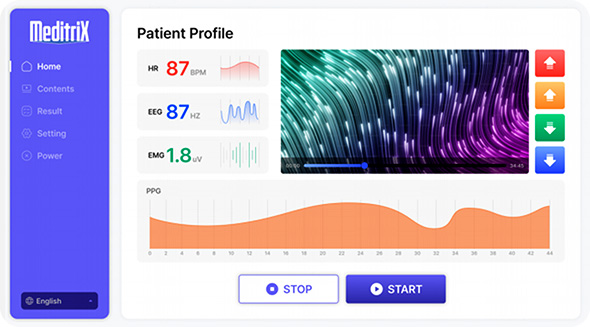
Is a medical device that measures brainwaves and assesses mental and physical responses through the collection of biometric signals. Real-time feedback is provided in the form of pictograms that the patient can recognize, so that the patient can control physiological parameters on his or her own.
Video Introduction to Mind Chair
How-to Video
Introduction to the Result Paper
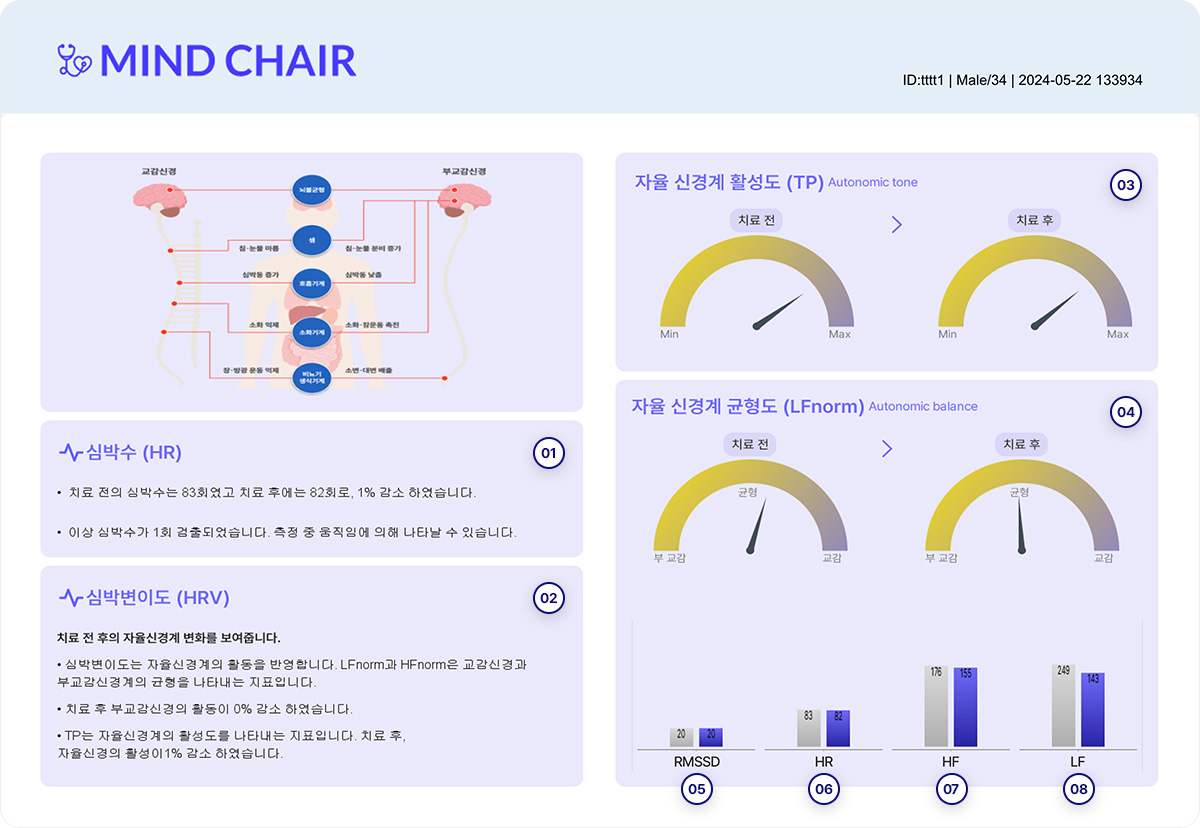
01HR
- The average HR value indicates whether the heart rate has increased or decreased.
- The number of sensor and finger missing errors during measurement is indicated by the abnormal heart rate.
02HRV
- It indicates whether TP has increased or decreased.
- It explains the indicators of LFnorm, Hfnorm and TP.
03TP
The TP log value is calculated as a percentage and displayed before and after the test in the gauge chart.
04LFnorm
The LFnorm value is displayed before and after the test in the gauge chart.
05RMSSD
The log value of the RMSSD value is calculated as a percentage and displayed before and after the test in the bar chart.
06HR
The average HR value is displayed before and after the test in the bar chart.
07HF
The log value of HF is calculated as a percentage and displayed before and after the test in the bar chart.
08LF
The log value of the LF value is calculated as a percentage and displayed before and after the test in the bar chart.
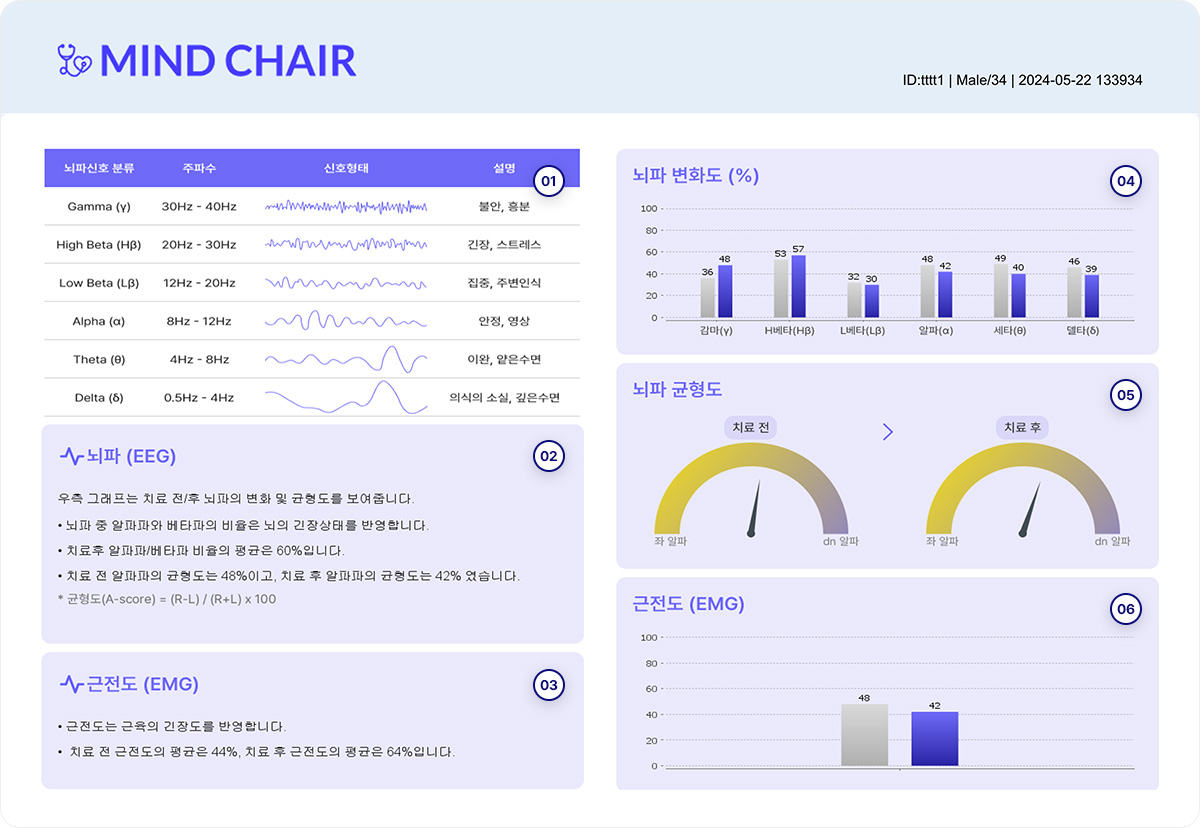
01Brainwave Explanation Table
It explains the meaning of each EEG signal.
02EEG
- It explains alpha/beta waves.
- It indicates the average of alpha/beta waves.
- It indicates the alpha wave balance before and after the test.
03Electromyography (EMG)
- It explains the EMG.
- It indicates electromyographical average before and after the test.
04Brainwave Variation
The average of the pre- and post-examination brainwaves is displayed in the bar chart.
05Brainwave Balance
The brainwave balance before and after the test is displayed in the gauge chart.
06EMG
The EMG value before and after the test is displayed in a bar chart.
Operating SW